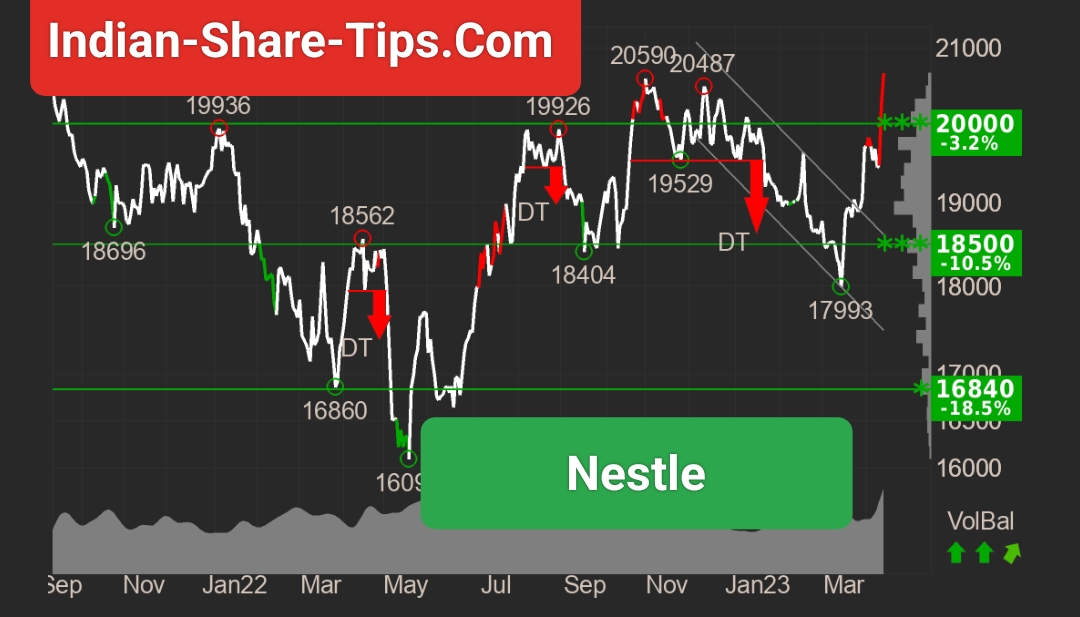
Nestle India Limited has broken the falling
trend channel in the medium long term and
reacted strongly up. For the time being, it is
difficult to say anything about the future trend
direction. The stock has broken a resistance
level and given a positive signal for the long-
term trading range. There is no resistance in
the price chart and further rise is indicated. In
case of a negative reaction, the stock has
support at approximately 20000 rupee.
Positive volume balance indicates that buyers
are aggressive while sellers are passive, and
strengthens the stock.
RSI above 70 shows
that the stock has strong positive momentum
in the short term. Investors have steadily paid
more to buy the stock, which indicates
increasing optimism and that the price will
continue to rise. However, particularly for big
stocks, high RSI may be a sign that the stock
is overbought and that there is a chance of a
reaction downwards. The stock is overall
assessed as technically positive for the
medium long term.