 Edit this post
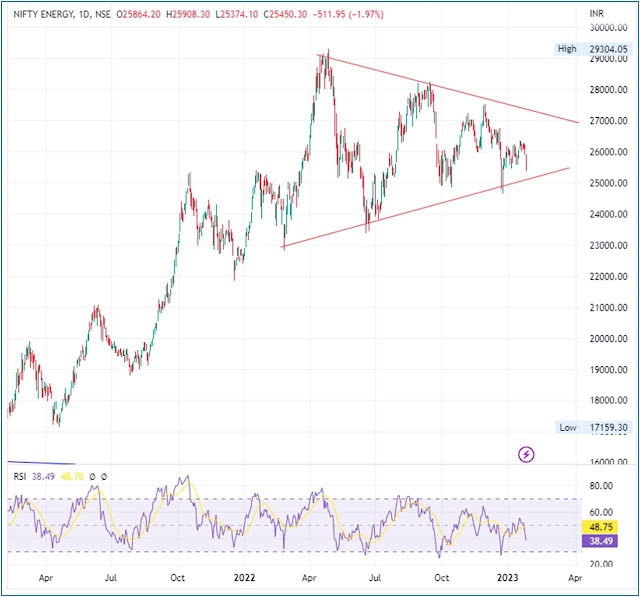
The index is moving within a symmetrical triangle pattern on the daily chart and is now near the lower end of the triangle pattern, which is near the 25000 level. On the daily chart, a close below these levels will result in a breakdown. At the same time, if there is consolidation or a reversal seen near 25000 levels, we may again witness an upward move towards the upper range of the triangle near 27200 levels.
Trade like a professional trader using our bank nifty option tip for the day and be a part of profit making team on a daily basis.
The Nifty Energy Index is a stock market index that tracks the performance of companies in the energy sector that are listed on the National Stock Exchange of India (NSE). The index is designed to measure the performance of the Indian energy sector and is composed of the top companies in the sector listed on NSE.
The Nifty Energy Index is a market capitalization weighted index, which means that the weight of each stock in the index is determined by its market capitalization, or total value of outstanding shares. The index is calculated using free float market capitalization weighted methodology, where the level of the index reflects the total free float market value of all the stocks in the index relative to a particular base market capitalization value.
The Nifty Energy Index is widely used as a benchmark to measure the performance of the Indian energy sector and is considered as a barometer of the Indian energy industry. It is also used as a benchmark by investors and fund managers to track the performance of their investments in the energy sector.
The Nifty Energy index is currently composed of 10 companies which include Oil and Natural Gas Corporation, Bharat Petroleum Corporation, Reliance Industries and Indian Oil Corporation. The current market capitalization as of 2021 is around INR 21.7 Trillion.


